Summary
To get a full picture of the operations of a Company, it is of paramount
importance to understand how Profits translate into Cashflows over time.
If there is one thing to remember, is that Profits is different
from Cashflows and that the relationship between both, can be described by a
simple equation takes into account the impact of time:
This note sets the foundations required to understand more advanced topics in the future.
Step 1
Cashflows = Profits + Time Impact
Cashflows and Profits are defined in the same way, i.e. revenues net of costs, but they are not measured on the same basis.
 Figure 1: Cashflows vs profits.
Cash basis: cash revenues and cash costs are based on when they are respectively received or paid.
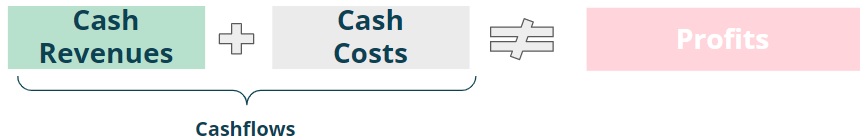 Figure 2: Cash basis for Cashflows.
Let's use an example to make it easier to understand. During a certain year, a Company has the following cash transactions:
- Cash revenues = £100 received in months 3, 6, 9, 12 and 15
- Cash costs = (£30) paid in months 4, 7, 10 and 13 Note: Numbers in brackets are used to indicate a negative number,
i.e. (£30) = -£30.
The Cashflows for the year would thus be £310 = £400 cash revenues minus £90 cash costs. Any revenue received or cost paid post month 12 would not count towards the yearly figure.
Profit and Loss (P&L) basis: there are rules, based on different accounting standards, that stipulate when revenue is earned and when costs are incurred.
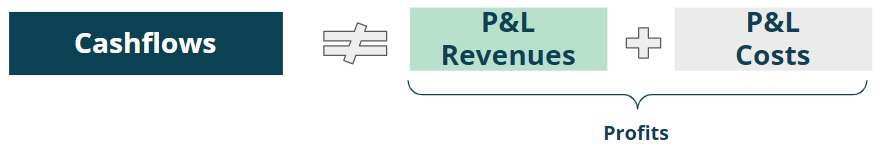 Figure 3: P&L basis for Profits.
Cashflows can be derived from Profits if one takes into account the time impact of (i) receiving revenues vs earning them and (ii) paying costs vs incurring them, i.e. Cashflows = Profits + time impact.
Going back to the previous example
- P&L Revenues = £100 earned in month 1, 3, 6, 9 and 12 (received 2 months later)
- Quarterly P&L Costs = (£30) incurred per quarter, paid after quarter end
The Profits for the year would thus be £380 = £500 P&L revenues minus £120 P&L costs.
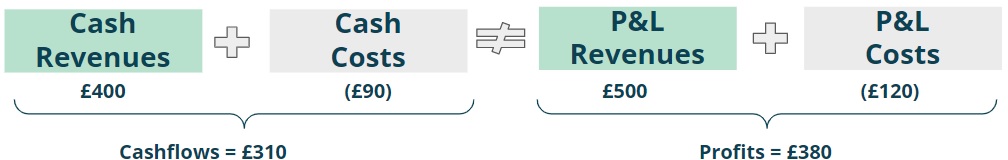 Figure 4: Cashflow basis vs P&L basis.
Let's keep going through the previous example:
- From a revenue perspective, the company received £400 cash revenues and earned £500 of revenues.
The time impact was thus (£100) relating to the £100 that was earned in month 12 but was only received in month 15. - From a cost perspective, it paid out three quarters (£90) but incurred
(£120) relating to four quarters.
The time impact was thus £30 relating to fourth quarter costs that were paid in month 13.
The overall time impact was thus (£70k)=(£100)+£30.
 Figure 5: Time impact (£70) = £310-£380 = (£100) from revenues +£30
from costs.
Figure 5: Time impact (£70) = £310-£380 = (£100) from revenues +£30
from costs.
Step 2
Balance Sheet = Keep a Score Sheet
In the prior sections, we have discussed two simplified versions of the financial statements of a Company for a certain time period:
- Cashflows = net change in cash position for the period
- P&L = cumulative profit or loss for period
To tie everything together we need to introduce a third financial statement, called the Balance Sheet.
Let’s connect sports and accounting (ugh how is that possible?). Pick any sport you like that has two teams and think about the beginning of the match: nothing has happened and therefore there is no score. Over time each team will score points and the Score Sheet is updated accordingly. At the end of the match there will be a final Score Sheet, which includes the sum of all the points scored for each team. A Balance Sheet works the same, and at any moment in time it provides a snapshot of the running score between two teams (albeit the score, or balance, is shown in a slightly different way). There are four fundamental archetypes that can be used to cover the vast majority of transactions in a Company.
Archetype #1: Revenues
Going back to the original example in this note, what would the final Score Sheet
look like for each revenue "team" at the end of the year (month 12)?
TEAM P&L REVENUES thus wins the game by a margin of £100. In accounting terms however, the overall Score Sheet or Balance Sheet is shown in a slightly different way (after all this is accounting stuff…):
The Score Sheet (i.e. Balance Sheet) for the game is shown as:
- Assets - (i) cash and assets that will convert into cash in the future, (ii) cash paid upfront for costs incurred over time and (iii) assets paid upfront that are used to generate future revenues
- Liabilities - (i) amounts that will have to be paid in the future, (ii) cash received upfront for revenues not earned yet and (iii) cash received upfront relating to external debt raises from investors
- Equity - balancing item to make sure that the equation below balances
Equity is thus the residual claim that
Shareholders have on a Company's Assets net of its Liabilities. Whatever is left
is owed to them, to compensate for the risk taken to invest in the Company.
Equity may be a negative figure, when losses incurred over time are greater than the
initial Equity investment from Shareholders - in this situation the Company is
insolvent which is a red flag. When this happens it is very likely that within 12 months,
the Company runs out of cash to pay the bills.
To put it in another way, Runway is equivalent to when
the Company runs out of cash and the Equity position is a forward looking indicator of when this will likely happen.
The Balance Sheet can thus be analysed to determine the financial strength of a Company.
Coming back to the example at the start of this note, for Archetype #1 (Revenues), the Score Sheet for the game (i.e. the Balance Sheet) would be rewritten as:
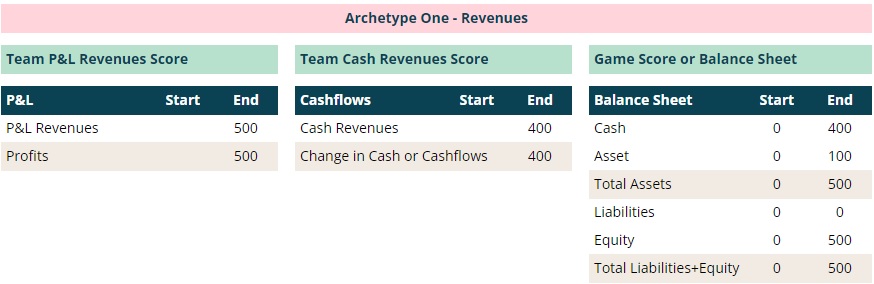 Figure 6: Three financial statements for Archetype #1 (Revenues).
Note: In the 12 months period there is one P&L statement, one Cashflow statement and two Balance Sheets
(one snapshot at the start of month 0 and another snapshot at the end of month 12).
Figure 6: Three financial statements for Archetype #1 (Revenues).
Note: In the 12 months period there is one P&L statement, one Cashflow statement and two Balance Sheets
(one snapshot at the start of month 0 and another snapshot at the end of month 12).
Archetype #2: Costs Let's repeat the exercise for TEAM CASH COSTS vs TEAM P&L COSTS:
In accounting terms, the score would be written slightly different as:
The balancing item of £30 will have to be paid from cash at the bank in the future, i.e. it is a liability. For Archetype #2 (Costs), the Score Sheet for the game (i.e. the Balance Sheet) would be rewritten as:
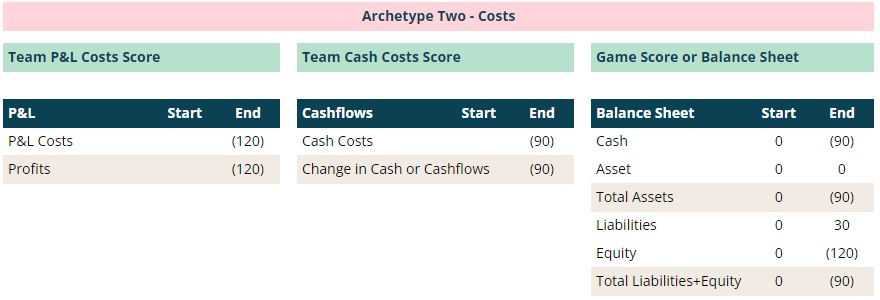 Figure 7: Three financial statements for Archetype #2 (Costs).
What is the Overall Score? GAME 1 SCORE (REVENUES) + GAME 2 SCORE (COSTS) The examples above, describe two fundamental archetypes that are used as building blocks to produce the financial statements of a Company. Let's put this to use in the original example by simply adding up the two archetypes.
| Assets | Liabilities | Equity | |
|---|---|---|---|
| Archetype #1 | £400 Cash + £100 | 0 | £500 |
| Archetype #2 | (£90) Cash | £30 | (£120) |
| #1 + #2 | £310 Cash + £100 | £30 | £380 |
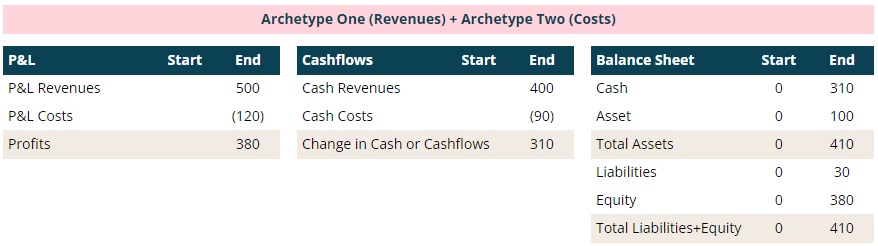 Figure 8: Three financial statements built using Archetypes 1 and 2.
From a P&L and Cashflows perspective we get respectively to £380 and £310. The time impact of (£70) is a consequence of:
- assets increase by £100
revenue is earned in month 12 and received in month 15, which has a negative impact in Cashflows, as the cash inflow will occur later - liabilities increase by £30
cost is incurred in month 12 and paid in month 13, which has a positive impact in Cashflows, as the cash outflow will be paid later
In summary, when Assets in the Balance Sheet increase, Cashflows decrease and when Liabilities increase, Cashflows increase as well.
Step 3
Cashflows = Profits - Change in Working Capital
You may have heard in the past the term “Working Capital” and searched online the term to get the below:
"The capital of a business which is used in its day-to-day trading operations, calculated as the current assets minus the current liabilities"
Clear as mud right?
The following figure is replicating the Balance Sheet from the previous section, with two small changes:
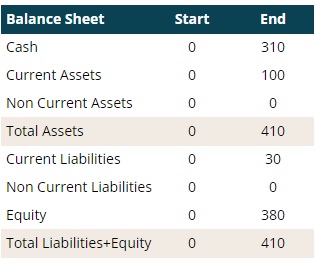 Figure 9: Balance Sheet with split between current and non current.
- Assets were split into two lines:
(i) current assets (CA): assets to be converted into cash or cash paid upfront for costs to be incurred, both within 12 months
(ii) non current assets: assets that will take more than 12 months to be converted to cash or are assets paid upfront to generate future revenues - Liabilities were split into two lines:
(i) current liabilities (CL): amounts owed to be paid within 12 months or cash received upfront for revenues to be earned within 12 months
(ii) non current liabilities: amounts owed that will take more than 12 months to be paid (very rare to be paid upfront >1 year of revenues)
The difference between CA and CL is called "Net Current Assets" or "Working Capital".
When Assets increase, Cashflows decrease,
therefore whenever Working Capital increases, Cashflows will reduce.
At the start the period WC = 0 = CA - CL; at the end of the period WC = £100 - £30 = £70.
Since WC increased by £70, Cashflows must have decreased by the same amount.
Does this number look familiar?
Hopefully yes… the change in WC of £70 is the time impact of Profits vs Cashflows:
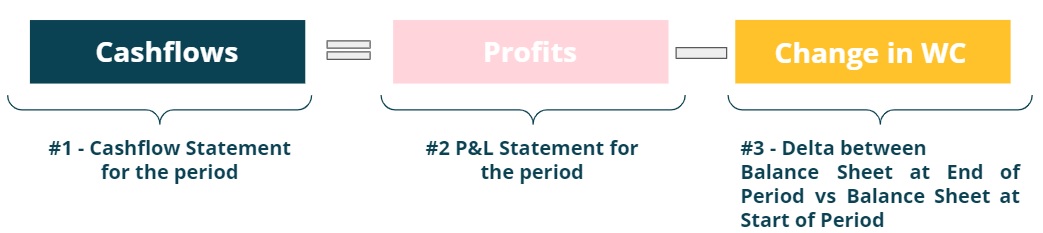 Figure 10: Cashflows (£310) = Profits (£380) - Change in WC (£70).
Why is Current Assets minus Current Liablities called Working Capital?
The figure below is plotting the cumulative Profits and Cashflows on a monthly basis between
month 1 and month 15.
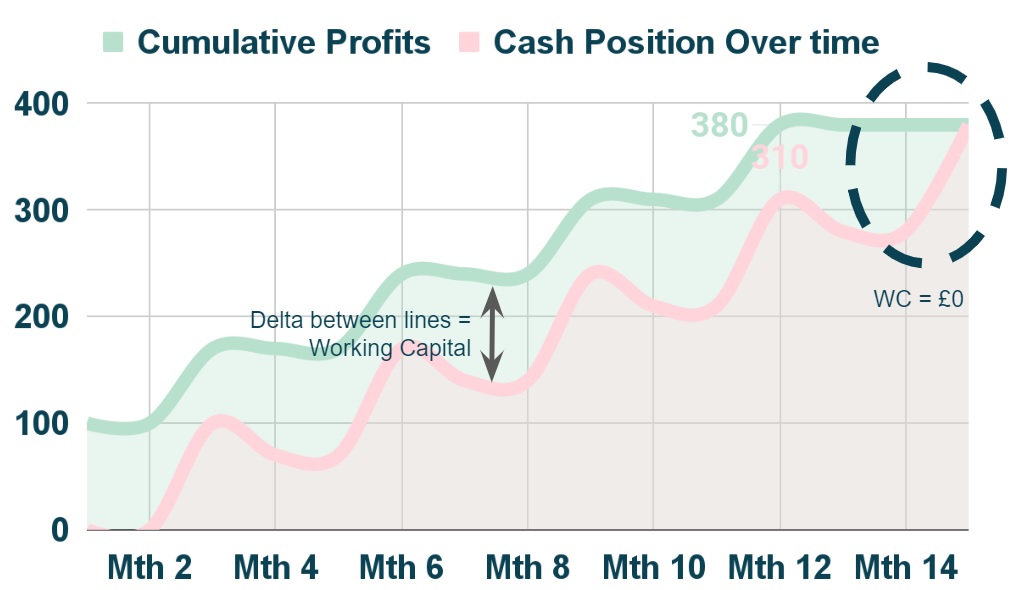 Figure 11: Delta between Profits and Cashflows = Working Capital .
If revenues were received as soon as they were earned, and costs were paid as soon as they were
incurred, the pink line for the cash position over time would exactly match the green line for the cumulative Profits.
Figure 11: Delta between Profits and Cashflows = Working Capital .
If revenues were received as soon as they were earned, and costs were paid as soon as they were
incurred, the pink line for the cash position over time would exactly match the green line for the cumulative Profits.
There is typically a delay between (i) earning and receiving revenues (Current Asset) and
(ii) incurring and paying for costs (Current Liability), and as a consequence the cash position
ends up being lower (unless the Company is able to be paid upfront for revenues not earned yet,
in which case the cash position could be higher).
The delta between the two lines represents cash tied up in the Company's operations that cannot be used to pay
the bills (profits cannot be used to pay an invoice, only cash can be used for a payment, i.e.
cash pays the bills).
Replace the words "cash" by "Capital" and "operations" by "Working" and reverse the order and you get to what
is called Working Capital = Current Assets - Current Liabilities.
Notice that in month 15 the delta between both lines collapses to zero because there
are no more revenues or costs to be received or paid.
This implies that the Company would cease operations; in practice what would happen is
that it would continue to generate revenues and incurs costs (with delays to receive and pay)
and there would be an ongoing Working Capital level.
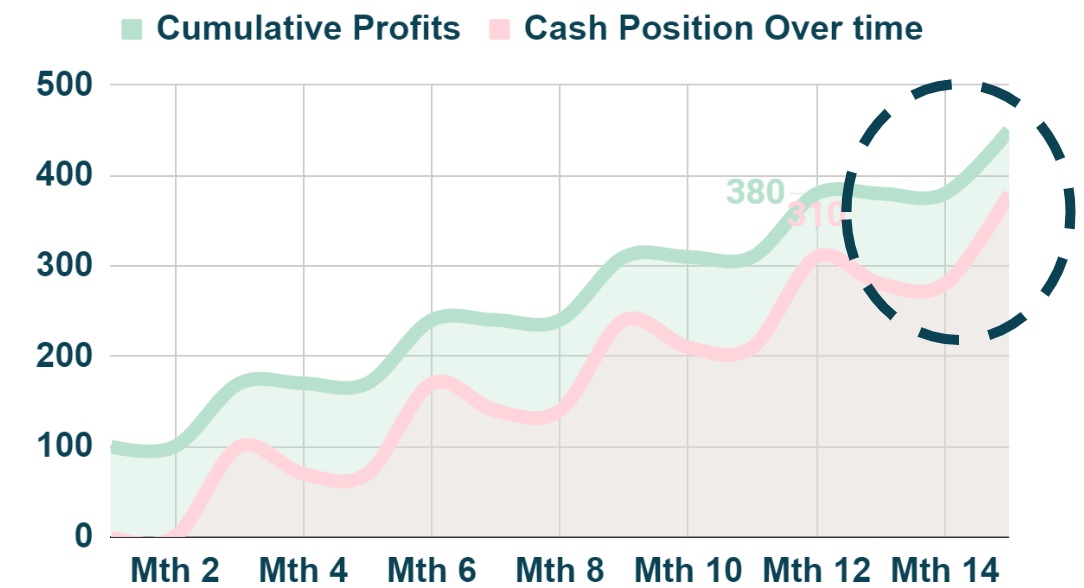 Figure 12: Ongoing Working Capital.
Final Step
Cashflows = Profits - Change in Working Capital - Capital Expenditures
There are two remaining archetypes:
i) Cash revenues received upfront for revenues not earned yet (think SaaS
business where a subscription is paid one year upfront) or
ii) Cash costs paid upfront for costs incurred over time (think that you are the client to
the SaaS business).
In both cases, there is no P&L impact since there is
no revenue earned or cost incurred.
Archetype #3: Receive cash revenues before earning revenues
Cashflows increases by e.g £100. In the Balance Sheet, cash
goes up by the same amount and current liabilities (assuming it relates to one year or less)
increase by £100,
since revenues have not been earned yet.
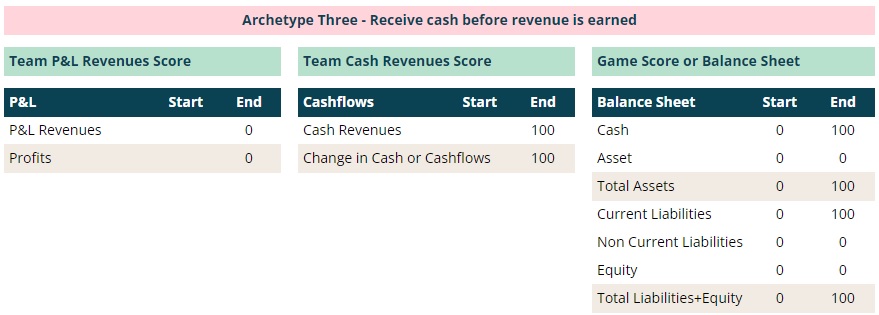 Figure 13: Three financial statements for Archetype #3 (Receive cash
before earned).
Figure 13: Three financial statements for Archetype #3 (Receive cash
before earned).
Archetype #4: Pay cash cost before incurring it
Cashflows decreased by e.g £100.
In the Balance Sheet, cash decreases by the same amount and current assets
(assuming it relates to one year or less)
increase by £100, since the cost was not incurred yet.
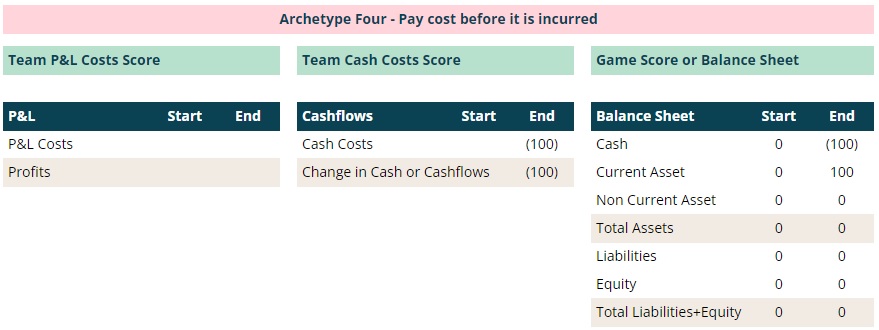 Figure 14: Three financial statements for Archetype #4 (Pay
before cost is incurred).
Figure 14: Three financial statements for Archetype #4 (Pay
before cost is incurred).
Archetype #4b: Purchase a long term asset
There is a slightly different version of the prior archetype.
This relates to when cash is spend to purchase an asset that will be used for
several years to generate additional cashflows.
In this situation, the cash cost is
called "Capital Expenditure" or "Capex". If we use the same example, cashflows decreased by e.g £100.
In the Balance Sheet, cash decreases by the same amount and non-current assets
(since it relates to more than one year)
increase by £100.
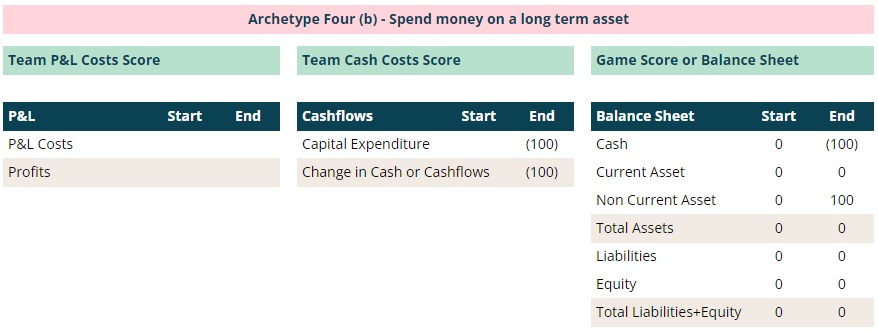 Figure 15: Three financial statements for Archetype #4b (Capex expenditure).
Given that the cash spent on the new asset, shows up in the Balance Sheet as a non-current asset,
the equation that relates
Cashflows to Profits needs to be updated to include "Capex", as this is not picked up by the change in Working
Capital.
Figure 15: Three financial statements for Archetype #4b (Capex expenditure).
Given that the cash spent on the new asset, shows up in the Balance Sheet as a non-current asset,
the equation that relates
Cashflows to Profits needs to be updated to include "Capex", as this is not picked up by the change in Working
Capital.
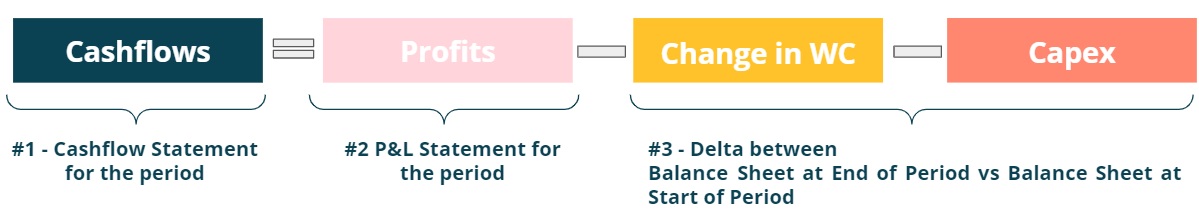 Figure 16: Cashflows = Profits - Change in WC - Capex.
Conclusion
There were a considerable amount of topics covered here to build intuition and
the foundations required for advanced topics.
If there is one thing to remember, is that Profits is different
from Cashflows and that the relationship between both can be described by a
simple equation that takes into account
the impact of time:
Why go through the hassle of explaining all this?
These concepts set the foundations required to understand
a future note, which will cover different types of business models and how important it is to be able to
connect Profits to Cashflows, in order to determine how easy (or not) it is to scale a Company from a Cashflow
perspective.
If you require support or have any questions my contact is: 